
Project management risk identification
In this tutorial you will learn:
How to perform training to learn the factor probabilities in the model
How to use inference to query the model and reason about probabilities
How to perform inference in the model editor or the Python SDK
How to interpret the results of inference
We will use an construction project management risk identification dataset (Qazi et al. 2016) and attempt to answer the following question:
Problem statement: Based on possible risks in the construction project management process, what is the probability of
A decrease in the quality of work
Low market share/reputational issues
Time overruns
Cost overruns
The model file and sample data for this example is shown below:
Network variables and categories
For this network we will use the following variables:
C1
[YES, NO]
Lack of experience with the involved team?
C2
[YES, NO]
Use of innovative technology?
C3
[YES, NO]
Lack of experience with technology?
C4
[YES, NO]
Strict quality requirements?
C5
[YES, NO]
Multiple contracts?
C6
[YES, NO]
Multiple stakeholders and variety of perspectives?
C7
[YES, NO]
Political instability?
C8
[YES, NO]
Susceptibility to natural disasters?
R1
[YES, NO]
Contractor's lack of experience?
R2
[YES, NO]
Suppliers' default?
R3
[YES, NO]
Delays in design and regulatory approvals?
R4
[YES, NO]
Contract related problems?
R5
[YES, NO]
Economic issues in country?
R6
[YES, NO]
Major design changes?
R7
[YES, NO]
Delays in obtaining raw material?
R8
[YES, NO]
Non-availability of local resources?
R9
[YES, NO]
Unexpected events?
R10
[YES, NO]
Increase in raw material price?
R11
[YES, NO]
Changes in project specifications?
R12
[YES, NO]
Conflicts with project stakeholders?
R13
[YES, NO]
Decrease in productivity?
R14
[YES, NO]
Delays/interruptions?
O1
[YES, NO]
Decrease in quality of work?
O2
[YES, NO]
Low market share/reputational issues?
O3
[YES, NO]
Time overruns?
O4
[YES, NO]
Cost overruns?
Variables with the prefix C are priors which are given a discrete uniform distribution. Variables with the prefix R are conditional or intermediate variables in the model. Variables with the prefix O are output variables whose probabilities we are interested in.
Examining the network
Although the model is stored internally in Genius as a factor graph, it is often more intuitive to examine the Bayesian network. This network has the following structure:
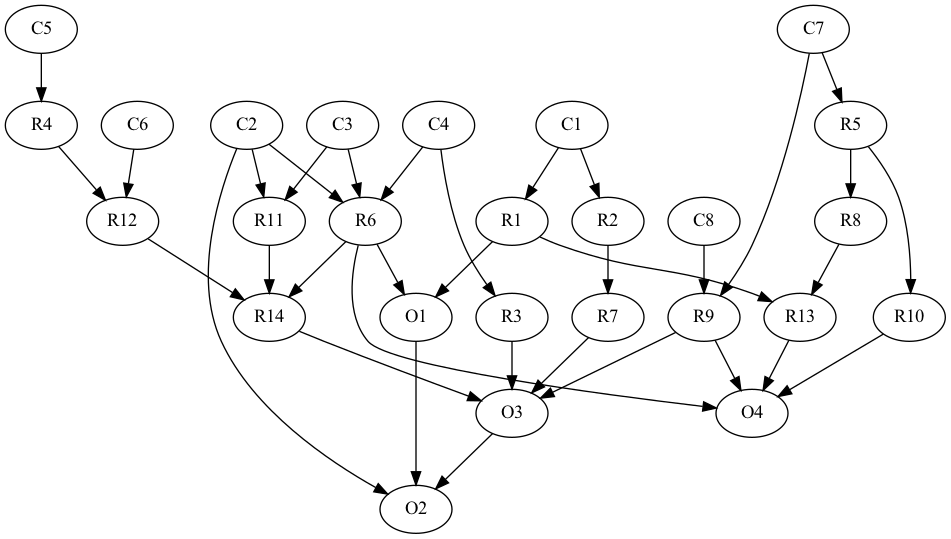
Here are some things we can conclude from this network:
Delays/interruptions (R14) depend on conflicts with project stakeholders (R12), changes in project specifications (R11), and major design changes (R6).
Time overruns (O3) depend on delays/interruptions (R14), delays in design and regulatory approvals (R3), and delays in obtaining raw material (R7).
Cost overruns (04) depends . n major design changes (R6), unexpected events (R9), decrease in productivity (R13), and increase in raw material price (R10).
Low market share/reputational issues (O2) depends on time overruns (O3), decrease in quality of work (O1), and use of innovative technology (C2)
Model training (parameter learning)
We will assume that the probabilities in the Bayesian network are not available for this task and must be collected from the real world. In this case, we assume that past projects by the company can be used to create a dataset much like we did in the electric vehicle fire risk example.
Here we follow the steps for workflow #2 in the model editor. However, we could also use workflow #1 and use the Data to Model Wizard.
First, we must build the model in the model editing canvas using the Model Panel interface and set all the probabilities to uniform. This choice of probabilities is the default when we first create a model in the model editor. Now we are ready to perform training (parameter learning). To make this process quicker, the model with uniform probabilities is provided below in the model files and sample data section.
Select
Modelin the main menu.Click
Opento load a model from JSON and load the fileprojectmanagement_uniform.jsoninto the model editing canvas.
You should see the model appear in the model editing canvas. If you inspect the properties of each factor you will see that the probabilities are set to uniform. The next step is to train the model to learn the parameters.
Select
Modelin the main menu.Click
Train.Follow the prompts on the screen to upload the
projectmanagement_2000.csvdataset for training.
If you inspect the probabilities for each factor you will see that the values have changed from uniform to new values determined by the imported data.
First, we load in a version of the project management model that contains uniform probabilities:
Assuming the dataset is stored in a file called projectmanagement_2000.csv, we can learn the model parameters as follows:
If you inspect the factor probabilities you will see that learning is successful.
Inference
Next, we use the network to answer our problem statement. Let's use the following fictitious scenario:
Suppose after we build the above network a new construction project begins. It is observed that the contractor lacks experience (R1), there are major design changes (R6), delays in obtaining raw materials (R7), changes in project specifications (R11), and conflicts with project stakeholders (R12). Now we wish to answer the problem statement - what is the probability of:
A decrease in the quality of work
Low market share/reputational issues
Time overruns
Cost overruns
First, click on the inference tab in the information panel and select O1, O2, O3, or O4 depending on which variable we are interested in determining the probability of. Then under "what do you want to observe?" set the following variables to "yes": R1, R6, R7, R11, R12. Then click "Run".
The probability of a decrease in the quality of work (O1):

The probability of low market share/reputational issues (O2):

The probability of time overruns (O3):

The probability of cost overruns (O4):

First we build the evidence for the different scenarios listed above:
Now we run inference for each of the variables we are interested in
{'YES': 0.9804270462633452, 'NO': 0.019572953736654804}
{'YES': 0.712012055011406, 'NO': 0.287987944988594}
{'YES': 0.9500028623166014, 'NO': 0.04999713768339855}
{'YES': 0.9500028623166014, 'NO': 0.04999713768339855}
Interpreting the results
The observed evidence for the project suggests a high risk in the decrease of quality of work, time overruns, and cost overruns. The probability of low market share/reputational issues is lower but still quite high.
Last updated