
Insurance
In this tutorial you will learn:
How to use inference to query the model and reason about probabilities
How to perform inference in the model editor or the Python SDK
How to interpret the results of inference
Car insurance companies must frequently evaluate the cost of a claim for a particular policyholder. This enables the company to determine how to set the cost of the policyholder's insurance premium. In other words, a "riskier" policyholder is likely to have more expensive claims and may be charged a higher insurance premium.
The expected cost of an insurance claim is evaluated on the basis of a number of factors that insurance companies gather about the policyholder such as demographic information, the type of car its safety features, the age of the car (based on its year and/or mileage), and the policyholder's driving history.
Problem statement: How can we calculate the expected medical claims cost, liability claims cost, and property claims cost of a given policyholder?
The model file and sample data for this example is provided below:
Examining the network
We will utilize a Bayesian network of insurance claim inference provided in (Binder et al. 1997). This network consists of the following variables
Accident
[None, Mild, Moderate, Severe]
How severe is the accident?
Age
[Adolescent, Adult, Senior]
What is the age of the policyholder?
Airbag
[True, False]
Does the car have an airbag?
AntiTheft
[True, False]
Does the car have antitheft features?
Antilock
[True, False]
Does the car have antilock breaks?
CarValue
[FiveThou, TenThou, TwentyThou, FiftyThou, Mil...
What is the value of the car?
Cushioning
[Poor, Fair, Good, Excellent]
What is the quality of the car cushioning?
DrivHist
[Zero, One, Many]
How many cars has the policyholder driven previously?
DrivQuality
[Poor, Normal, Excellent]
What is the quality of driving for the car?
DrivingSkill
[SubStandard, Normal, Expert]
What is the driving skill of the policyholder?
GoodStudent
[True, False]
Is the policyholder a good student?
HomeBase
[Secure, City, Suburb, Rural]
What type of environment does the policyholder typically drive in?
ILiCost
[Thousand, TenThou, HundredThou, Million]
What is the expected insurance liability cost for the policyholder?
MakeModel
[SportsCar, Economy, FamilySedan, Luxury, Supe...
What type of car does the policyholder drive?
MedCost
[Thousand, TenThou, HundredThou, Million]
What is the expected medical cost for the policyholder?
Mileage
[FiveThou, TwentyThou, FiftyThou, Domino]
How much mileage has been accrued on the policyholder's car?
OtherCar
[True, False]
Does the policyholder have another car?
OtherCarCost
[Thousand, TenThou, HundredThou, Million]
What is the cost of the policyholder's second car?
PropCost
[Thousand, TenThou, HundredThou, Million]
What is the expected property cost for the policyholder?
RiskAversion
[Risky, Adventurous, Normal, Cautious]
What is the risk aversion level of the policyholder?
RuggedAuto
[EggShell, Football, Tank]
What is the ruggedness of the vehicle the policyholder drives?
SeniorTrain
[True, False]
Has the policyholder participated in a senior driving training program?
SocioEcon
[Prole, Middle, UpperMiddle, Wealthy]
What is the socioeconomic status of the policyholder?
Theft
[True, False]
Has the policyholder's vehicle been involved in theft?
ThisCarCost
[Thousand, TenThou, HundredThou, Million]
What is the car's cost?
ThisCarDam
[None, Mild, Moderate, Severe]
What is the damage on this car?
VehicleYear
[Current, Older]
What is the year for the car?
The original source for the dataset uses the following model structure:
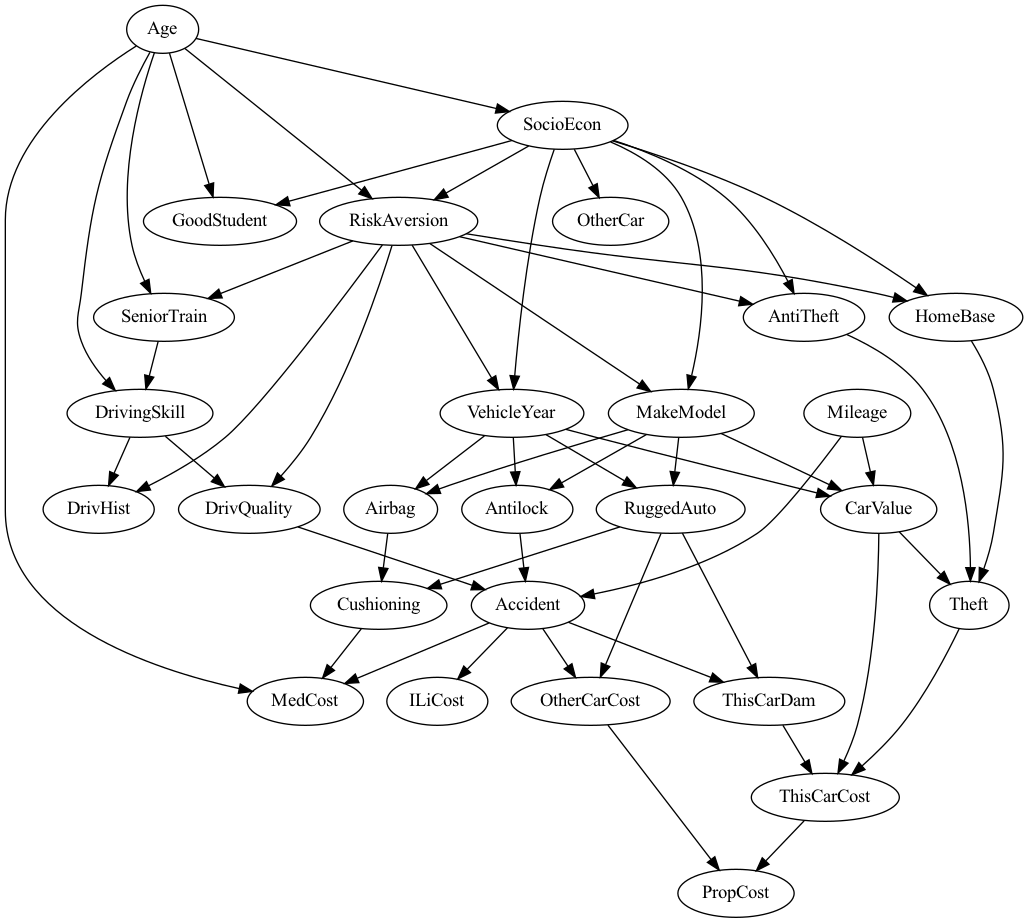
insurance datasetAs we can see, the network captures the possible dependencies among the different model variables in a way that is consistent with the real world. For example:
Being a good student, enrolled in a senior driving training program, driving skill, and risk aversion all depend on the age of the policyholder.
The driving quality of the policyholder depends on their driving skill and risk aversion.
The car's value depends on its mileage, the make/model, and the year it was manufactured.
Whether or not a car is likely to be stolen (
theft) depends on the car's value, whether or not it has antitheft features, and the environment the policyholder drives it in.The probability of an accident depends on the driving quality of the policy holder, whether or not the car has antilock breaks, and the mileage of the car.
These facts capture real world information that could be obtained from domain knowledge in the head of a modeler or from collected data. Although we might imagine many more variable and dependencies good predictions may still be possible.
Querying the model
We will investigate three scenarios in the model:
A young, risky driver with poor driving skills gets into a severe accident in an expensive but flimsy car without safety features.
An adult, average driver gets into a moderate accident in a family sedan with safety features.
An adult, expert driver gets into a mild accident in an economy car with safety features.
To query the model, we need to first connect to the agent, load a JSON model file, and send the loaded model to the agent. We will use the insurance JSON model file which can either be pasted into the box during loading or saved locally. After this is done, we are ready to query the model.
For all three examples listed in the bullet points above, we will be interested in the probability of property cost, medical cost, and insurance liability.
A young, risky driver with poor driving skills gets into a severe accident in an expensive but flimsy car without safety features.
To determine this we must use the Inference tab. Under the Inference section of this tab the question is "what do you want to know?" This is asking us what variable we are interested in inferring the probability of. We will start by querying for property cost PropCost. Under "What do you want to know?" select PropCost.
The traits of the policyholder described in bold above could be captured by the following evidence:
Accident=SevereAge=AdolescentAirbag=FalseAnitlock=FalseCarValue=FiftyThouDrivingSkill=SubStandardMakeModel=SportsCarRiskAversion=AdventurousRuggedAuto=EggShell
Now we click Run and get the results:

We can continue in this fashion for the medical cost and insurance liability cost:


An adult, average driver gets into a moderate accident in a family sedan with safety features.
For this example we need to find the probability of ILiCost, MedCost, and PropCost for the following evidence:
Accident=ModerateAge=AdultAirbag=TrueAnitlock=TrueCarValue=TwentyThouDrivingSkill=NormalMakeModel=FamilySedanRiskAversion=NormalRuggedAuto=Football
Following the same instructions in the model editor results in:


An adult, expert driver gets into a mild accident in an economy car with safety features.
For this example we need to find the probability of ILiCost, MedCost, and PropCost for the following evidence:
Accident=MildAge=AdultAirbag=TrueAnitlock=TrueCarValue=FiveThouDrivingSkill=ExpertMakeModel=EconomyRiskAversion=CautiousRuggedAuto=Football
Following the same instructions in the model editor results in:


First, we import the necessary libraries:
Next we load the insurance model into the GeniusModel class and then pass this model to a running GeniusAgent (assuming the Agent class is imported and initialized by connecting to the agent):
Now we build the evidence for the different scenarios listed above:
Since we are interested in determining the medical claims cost, liability claims cost, and property claims cost for the policyholder let's create a convenience function to display this information easily. This function just loops over the three variables whose probabilities we wish to evaluate, calculates inference for each variable, and prints out the (rounded) probabilities in a readable way.
PropCost: {'Thousand': 0.00014, 'TenThou': 0.00087, 'HundredThou': 0.81525, 'Million': 0.18374}
MedCost: {'Thousand': 0.36, 'TenThou': 0.27, 'HundredThou': 0.2, 'Million': 0.17}
ILiCost: {'Thousand': 0.8, 'TenThou': 0.1, 'HundredThou': 0.06, 'Million': 0.04}
PropCost: {'Thousand': 0.0376, 'TenThou': 0.04217, 'HundredThou': 0.79537, 'Million': 0.12487}
MedCost: {'Thousand': 0.947, 'TenThou': 0.0291, 'HundredThou': 0.0156, 'Million': 0.0083}
ILiCost: {'Thousand': 0.9, 'TenThou': 0.05, 'HundredThou': 0.03, 'Million': 0.02}
PropCost: {'Thousand': 0.6344, 'TenThou': 0.35112, 'HundredThou': 0.0141, 'Million': 0.00038}
MedCost: {'Thousand': 0.9917, 'TenThou': 0.00814, 'HundredThou': 0.00015, 'Million': 2e-05}
ILiCost: {'Thousand': 0.999, 'TenThou': 0.001, 'HundredThou': 0.0, 'Million': 0.0}
Interpreting the results
The results show that for the first driver the property cost is expected (most likely) to be in the hundreds of thousands, the medical cost is expected to be in the thousands, and the insurance liability cost in the hundreds. The medical claims cost could also potentially be in the tens of thousands, hundreds of thousands, or possibly even millions because the the probabilities are relatively close. Could we find a way to be more confident in the expected outcome? Examining the network, we can see medical claims cost depends on a number of variables for which we have no evidence in the model. Gathering data on these elements, or their parent dependencies, may improve the confidence in the inference.
The second driver is likely to incur property claims costs in the hundreds of thousands, medical costs in the thousands, and insurance liability costs in the thousands. Here the medical costs are likely to be much lower given the evidence about this driver.
The third driver is likely to incur property claims costs in the thousands to tens of thousands, medical costs in the thousands, and insurance liability costs in the thousands. Although the results are very confident for this driver this is also a rather extreme case and unlikely to represent the average driver.
Last updated