
Factor graphs
The previous tutorial introduced a visual representation of the probabilistic model as a Bayesian network. In this tutorial we will look at an alternative representation of the probabilistic model known as a factor graph. The factor graph representation is important because it provides the basis for how we will build models in Genius.
The factor graph representation conveys the same general information as a Bayesian network. The major difference comes down to the way that factor graphs enable efficient computation. In many cases the reasoning we would like to perform can be computationally expensive. Factor graphs allow us to break down a complex reasoning problem into smaller, less complex problems. Depending on the structure of the factor graph it may be possible to calculate these smaller problems in parallel leading to efficient processing.
Breaking the complex problem into simpler ones also means that we can more easily understand how the model comes to its conclusions. This enables more interpretable models whose predictions we can more easily communicate and explain to others.
Components of a factor graph
Both Bayesian networks and factor graphs are composed of nodes and edges. In Bayesian networks nodes represent variables of interest and edges represent the dependencies between these variables. The dependencies are indicated with an arrow head on the edges which makes Bayesian networks a directed graph. In factor graphs the nodes represent independent factors of the model or probability distributions over variables connected to factors. The edges, which connect to factors, represent the variables of interest. Factor graphs edges are undirected which means they do not have usually have arrow heads. To get a better understanding of factor graphs, examine the image below which shows the factor graph for the sprinkler model that we used in the previous tutorial:
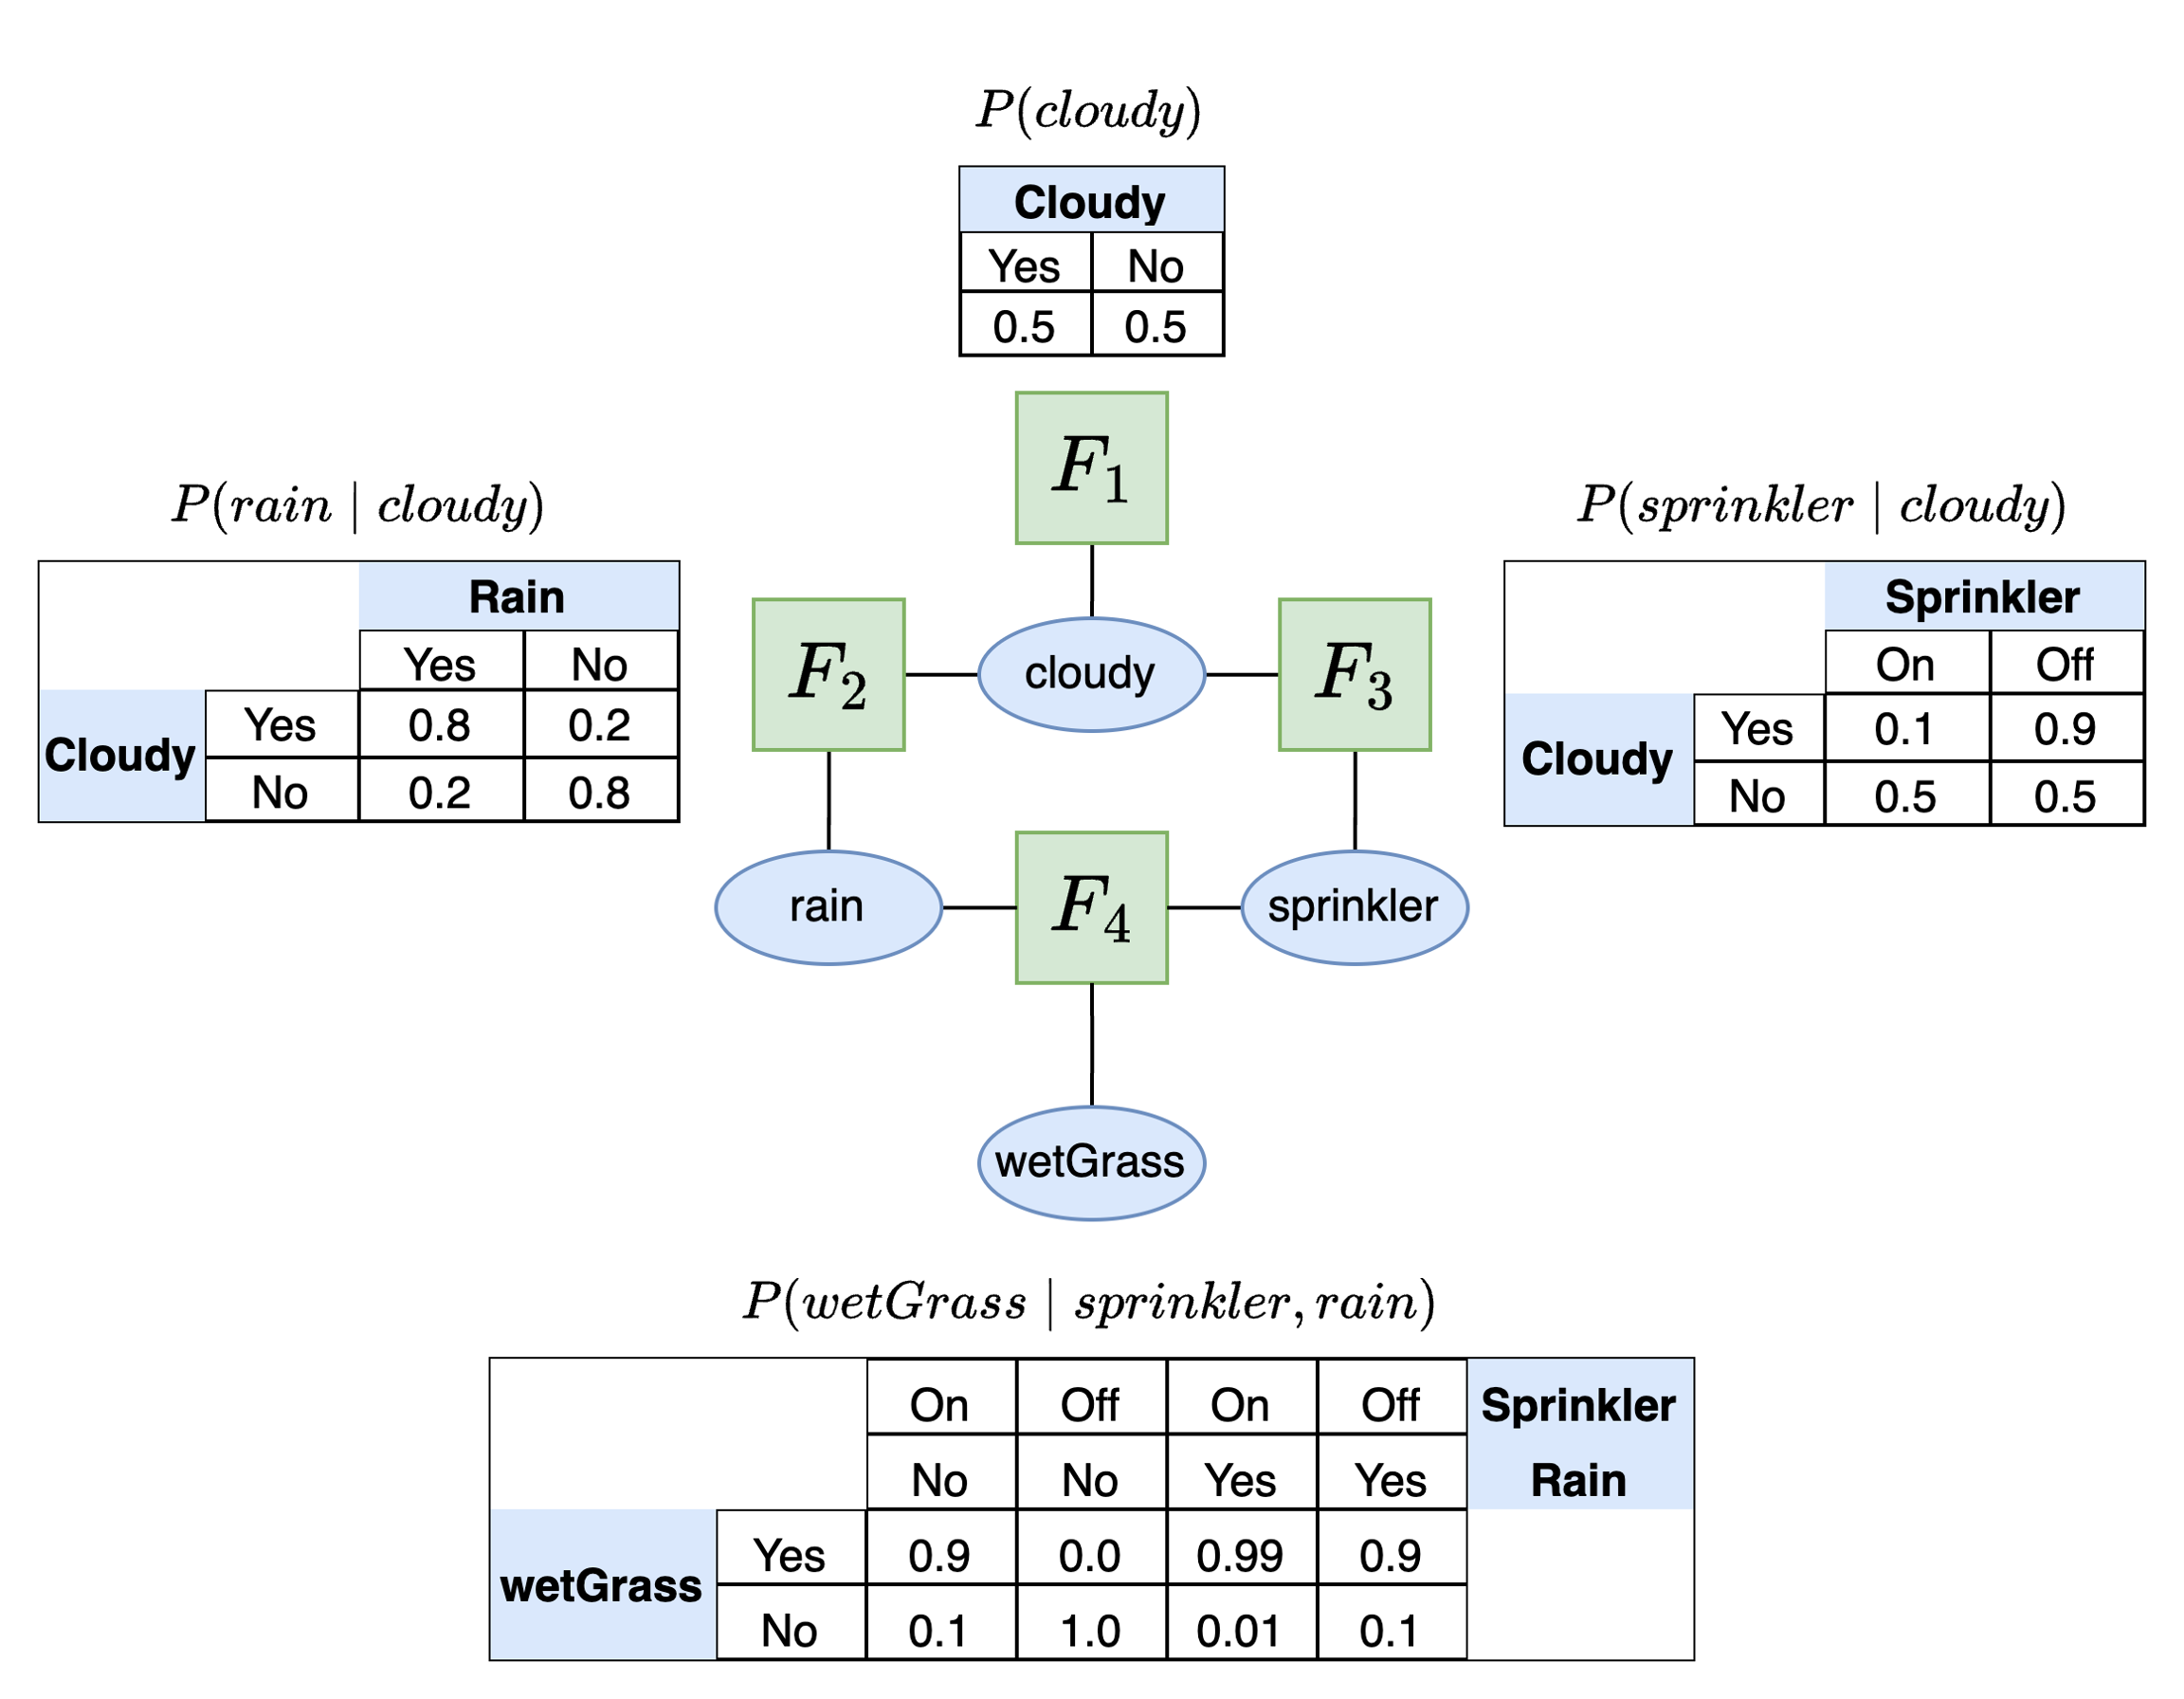
sprinkler datasetIn this factor graph we have denoted factors with the green, square nodes and labeled them F1 through F4. We have additionally placed the variables on the edge inside a blue, elliptical node. This is an optional choice - many factor graph representations remove this blue node and simple write the variable name over the edge itself.
In this particular factor graph, each factor graph is represented by a probability distribution. These factors represent the independent factorizations of the probabilistic model:
Each factor is connected to edges (variables) that interact with the factor.
Last updated