
Building a medical diagnosis model
In this tutorial we show an end-to-end example of creating a model using domain knowledge for diagnosing lung cancer(Lauritzen and Spiegelhalter 1988). This dataset was originally created to teach how to understand Bayesian networks. First we define the problem we are interested in modeling:
Problem statement: Let's suppose that a patient visits a clinic with shortness-of-breath (dyspnoea). Dyspnoea is a common symptom of for tuberculosis, lung, cancer, and bronchitis. If a patient presents this symptom, which of the diseases might they have, if any?
Although the structure of this model is well-known and included in the original source paper, we will play the role of a naive experimenter who is constructing this model from scratch to illustrate the model building process. This tutorial will cover the following steps:
Choose model variables and categories
Choosing model structure
Choose probabilities
Perform inference with a Genius agent
In answering the question at hand, a doctor may use their domain knowledge to form a mental model of this scenario. We can capture the key details of this scenario as follows [Lauritzen and Spiegelhalter 1988, pp. 163-164]:
If the patient visited Asia recently this could increase their chances of having tuberculosis
Smoking can cause lung cancer and bronchitis
A chest X-ray cannot distinguish between lung cancer and tuberculosis
The presence or absence of dyspnoea does not distinguish between lung cancer and tuberculosis
Smoking history and X-ray may tell us the most information about whether the patient has lung cancer
Let's try to create the structure of our model from this information.
Choosing model variables and categories
Our first goal is to choose the appropriate model variables to use in our model and the categories associated with each one. We will want to embody the three heuristics described in the model building tutorial:
Use clearly defined and documented variables
Create a model that simplifies reality but retains predictive accuracy
Choose variables we could actually observe and gather data about
We will assume that all variables are binary in this example with categories of "yes" or "no". Variables of interest and their associated categories are:
xray
Yes, No
Does the patient have a positive chest X-Ray?
smoke
Yes, No
Is the patient a smoker?
tub
Yes, No
Does the patient have tuberculosis?
asia
Yes, No
Has the patient visited Asia recently?
lung
Yes, No
Does the patient have lung cancer?
bronc
Yes, No
Does the patient have bronchitis?
dysp
Yes, No
Does the patient have dyspnoea?
either
Yes, No
Does the patient have either tuberculosis or lung cancer?
The either category is not strictly necessary and we will show below how it illustrates a way to simplify the model so that a variable has no more than two dependencies.
The above categories potentially satisfy the heuristics outlined above.
X-rays, smoking, and diseases/symptoms are all well-defined categories. The
asiacategory could use some clarification to define "recently".The model is simple, including many major components that matter for diagnosis.
The variables represent events that are "observable". That is, a doctor could ask patients the questions implied by the variables and obtain data.
As with any model, there is more than one way to represent reality. One could come up with additional variables and a different model. The model we have chosen is here is one particular way to think about the problem.
Choosing model structure
Now that we have the variables, we need to decide how the variables relate to one another by specifying dependencies. As emphasized in the model building tutorial, one strategy to building a model is working backward from a variable of interest to determine what it depends on. We will start with the xray variable.
What other variables in the chosen set could lead to a positive X-ray being the case? If the patient has lung cancer or tuberculosis, they could end up with a positive X-ray. This corresponds to the either variable.
What does having either tuberculosis or lung cancer depend on? Since the either variable is a stand in for having either tuberculosis or lung cancer, then we can add tub and lung as dependencies on either.
Tuberculosis is a prevalent in Asia and highly contagious so tub depends on asia. Meanwhile, lung cancer is related to smoking so smoke is a dependency to lung.
Dyspnoea could occur because the patient has tuberculosis or lung cancer or because they have bronchitis. So either and bronc are dependencies on dsyp. Finally, bronchitis is seen in smokers so smoke is a dependency of bronc. Putting this all together, we have the following Bayesian network and associated factor graph:
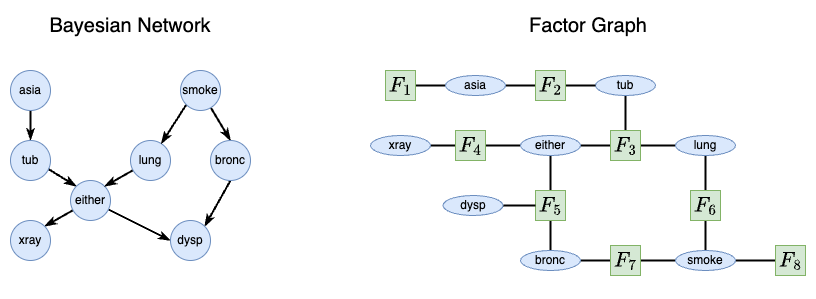
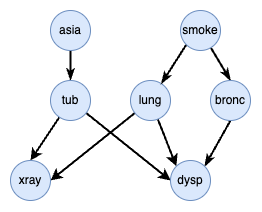
lung_cancer datasetNote that we could eliminate the either variable but it would result in a more complex graph that is more difficult to interpret. The either variable helps by reducing the number of connections in the graph and limits nodes to having no more than two dependencies. This is evidenced by the Bayesian network that would result from the either node eliminated:
lung_cancer dataset with the either variable eliminatedChoosing model probabilities
If a dataset is available, the probabilities could chosen using parameter learning. However the purpose of this example is to demonstrate how this process could be performed using just domain knowledge.
Finally, we will set the model probabilities. Ideally, one would want to gather real world data to populate the probabilities of the Bayesian network. This would entail finding a large sample of patients and surveying them on the various questions associated with the variables in the model. One would want a large set of representative sample for all possible combinations of "yes" and "no" states for each variable.
In the absence of this data, one could fill in the model probabilities with an educated guess. Presumably, this information is in the mind of a doctor who has formed the probabilities through her personal experience and medical training. Other sources of this information may be from other surveys or statistics of the general population that may be available.
We have a total of 8 probability distributions we need to fill in.
P(asia):
The first is the marginal probability of a patient visiting Asia recently in the absence of any other information. We could get this information, if available, from recent flight data and estimate how many people from the doctor's country have been returning from Asia. This gives us a base probability of how likely the patient would be to have just flown in from Asia:
0.01
0.99
P(tub∣asia)
Next, consider the probability of tuberculosis given that you traveled to Asia. This information would be reported in medical journals.
Rows asia , columns tub:
Yes
0.05
0.95
No
0.01
0.99
Note that while prevalent in Asia, getting tuberculosis is still a relatively rare event overall.
P(smoke)
What is the probability that a patient is a smoker, in the absence of any other information? This can be determined from looking at surveys of what percentage of the population is a smoker. If we are unsure we could use a discrete uniform prior and assume that probabilities is equal.
0.5
0.5
P(lung∣smoke)
The probability of having lung cancer if you are a smoker or not is something that would be reported in a medical journal or domain knowledge.
Rows smoke, columns lung:
Yes
0.1
0.9
No
0.01
0.99
P(bronc∣smoke)
The probability of having bronchitis given being a smoker or not is something that would also be reported in a medical journal or domain knowledge.
Rows smoke, columns bronc:
Yes
0.6
0.4
No
0.3
0.7
P(either∣lung,tub)
This is the probability of having either lung cancer or tuberculosis given that one has either lung cancer or tuberculosis (or both or neither). In this case, either functions as a kind of dummy variable that toggles between the different possible combinations. Since you either have bronchitis or you do not, or you have lung cancer or you do not, the probabilities will always be 1 for each combination.
Rows lung, tub, columns either:
Yes
Yes
1
0
No
Yes
1
0
Yes
No
1
0
No
No
0
1
P(xray∣either)
This is the probability of a positive chest X-ray given having either lung cancer or tuberculosis. This could also be obtained from medical journals or domain knowledge.
Yes
0.98
0.02
No
0.05
0.95
P(dsyp∣bronc,either)
This is the probability of having shortness of breath given either lung cancer/tuberculosis or bronchitis. Such information may not be directly available but a trained doctor might be able to reason through these possibilities. Here is a possible set of probabilities used in the paper where this dataset originates:
Rows bronc, either, columns dysp:
Yes
Yes
0.9
0.1
No
Yes
0.7
0.3
Yes
No
0.8
0.2
No
No
0.1
0.9
Next steps
With this information in hand, we could proceed to querying the network for various properties. This includes conditioning based on known data or performing Bayesian inference to explore reverse causal relationships.
Last updated